
By
Guy M. Burgess
Heidi Burgess
September, 2018
You can download this video from Vimeo for offline viewing.
Synopsis:
This post looks at society's big conflicts in distributional, rather than cultural, terms with the principal conflict being between the super-rich (folks with all the gold) and the other, more disadvantaged classes (which include both the "blue" cultural liberals and the "red" conservatives). This is why we call it the purple/gold divide. The post looks at the relationship between four, principal class-based groups: the "1% of the 1%" (the group that has, in recent decades been receiving almost all of the increasing wealth of society); the "meritocracy" (also referred to as the "top 9.9%," the "top 20%," or the "establishment elites" – folks who have been doing very well but not as well as the super-rich); the "left behind" (the lower working classes championed by Republicans); and the "protected classes" (the discriminated against groups championed by Democrats). The argument is that, as long as these last three groups can be played off against one another using divide-and-conquer propaganda techniques, it will be impossible to effectively challenge the power of the super-rich plutocrats or meaningfully address the inequality problem.
Full Transcript:
Slide 1. This is Guy Burgess. For this post, I want to look at the distributional divide, which is a different aspect of the authoritarian populism problem and the larger political divide that is tearing apart so many democracies including United States, which is our immediate focus (since this is what we know most about).,
|
|
Slide 2. Again, I want to start with a disclaimer. Because of the polarized nature of the conflict, and the strong feelings that folks have about it, it is hard to try to explain the many sides of the issue without saying things that some are going to find objectionable. As you listen to this post, I ask you to try to empathetically look at things from the perspective of the various parties, even though you may disagree strongly with those perspectives.
Slide 3. The distributional conflict that we are going to be talking about is something that we call the "purple / gold distributional divide." One extreme, pretty obviously, are the folks with gold, that is, all of the money. At the other end, you have the vast mass of the population which includes both conservatives and liberals. This is why we refer to this group as purple.
|
|


Slide 4. We are also talking about fairness and not absolute equality. I think that one of the misnomers in popular discourse is the way we keep talking about the inequality problem. I don't think there are many people who really want total equality. What most people don't want is gross inequality and gross unfairness. If we can fix some of that, we will have accomplished a great deal. Then we can work on getting closer to some sort of distributional ideal.
Slide 5. When I've taught about this over the years, I've used this chart, which looks at the distribution of wealth in U.S. society. What the authors did was conduct an opinion poll. They asked people what they thought the ideal distribution of wealth was. On the left side of the bottom bar, you have the proportion of the wealth that people thought that the richest 20% of the population should, ideally, be getting (which is a little over 30%). Respondents thought that the next 20% should get correspondingly less, and the middle 20% should get even less. But as you can see, respondents thought that each of the groups ought to get a reasonable chunk of the society's wealth.
They then asked people to estimate what they thought the distribution really was – not the ideal, but the estimated actual distribution. Respondents thought that, in reality, the richest 20% would be getting a lot more and everyone else would get correspondingly less.
The top bar shows what the actual distribution really is. The rich are really a lot richer than people estimated they were and the bottom 40% had so little wealth, that it didn't even show up on the chart. The richest 20% were pulling down something like 85% of the wealth in the society! That sort of unfairness is something that we think really needs to be addressed.
Slide 6. The authors also reported that they asked the same questions of different demographic groups, based on political party affiliation, gender, and income. You'll note that the results were not all that much different. So, there is a huge gap between the actual distribution of wealth in our society and what people think it ought to be.
Slide 7. Another way to get at this issue is with a calculation I did a number of years ago. I started with a simple observation that, in 1979, the richest 1% of the society pulled down 7.4% of the society's income. By 2007, it had gone up to 16.7%! So in 2007 alone, this shift amounted to $1,116 billion dollars or $1.1 trillion. Just for comparison, I have included some US budget items. The $1.1 trillion is basically enough to fund the Department of Defense and Social Security. Or, maybe Social Security, Medicare, and pretty much everything else in the Federal budget. This is an enormous amount of money to have been transferred from folks who were already pretty rich in 1979.
Slide 8. So what has happened since 2007? I found these charts that plot the increase in actual income and the changes in percentages.
Slide 9. So for 2014, the shift was again from 7.4% to only 12.4%, because of Obama era changes in tax law and other changes. This meant that the annual shift went down to about $700 billion dollars from $1,100 billion dollars. Still, that is an awful lot of money. To give you a sense of just how much money we are talking about, the highly controversial, Obama-era stimulus package, was $830 billion over 10 years, or roughly $83 billion a year. The shift in the income distribution is approximately eight times that every year.
Slide 10. The obvious question is what are the statistics going to say in the Trump era? I couldn't find numbers on this yet. Still there are lots of articles that suggest that the richest 1% are doing very well with the Trump tax cuts.
Slide 11. There are also international comparisons of gains by the 1%. It's clear from this chart that Russia led the pack with the United States in second place. Still, Britain, China, and even Canada have saw some large shifts in the distribution of income to the very rich. (If you are interested in the details you can follow the link in the reference section to this article.)
Slide 12. This very provocative article looks at the same problem from still another perspective. It explains how, until somewhere around 1972, worker productivity and hourly compensation went up in tandem. Since then, as you can see, productivity (the amount of value created for each hour of labor) continued to go up. But, the amount that was distributed in the form of hourly compensation to wage earners went flat. That's one of the dynamics that led, again, to this enormous shift in wealth to the very, very rich.
Slide 13. There are a lot of causes for this. . This is truly a complex problem. It isn't simply that the rich guys up and stole the money. In an earlier Frontiers post, I addressed this issue as part of an illustration of how complexity theory can be applied to an analysis of the causes of social problems. In that post, I looked at the example of economic inequality (or inequity).
Slide 14. I wound up identifying all of these different things that people think have contributed to the gross inequality we see now. Unfortunately, I couldn't estimate the importance of each of these factors. That would be methodologically difficult and controversial and I don't know of anyone who has attempted it. Still, it's likely that all of these factors play a role in some way.
Slide 15. Back to our main topic. We were trying to map the nature of distributional conflict. Thinking that it is just a matter of the rich versus the poor would, I think, be too simplistic. I think you need to look at things at a more granular level. In an effort to keep things manageable while still highlighting the important differences, I've broken things down into four basic groups (which could obviously be subdivided even further).
Slide 16. To start with, it's worth looking specifically at the very, very rich, the 1% of the 1%.
Slide 17. It is surprising to note that the 1% of the 1% did as well when compared to the rest of the 1% as the 1% did when compared to the rest of the society! In the chart on the right, the bottom line is how much income for the 1% went up since 1970. It's obviously pretty flat. The top line is how much income went up for the 1% of the 1%. So you're talking about a very small number, like 1/1000 of the population that is pulling down such an enormous share of our wealth and income. Now there are lots of reasons for this.
Slide 18. Thomas Piketty has a very popular book that talks about how capital in the 21st century and in prior periods was able to pull down such a huge share of the wealth. Kenneth Boulding has a simpler explanation that still makes a lot of sense, "To whomsoever hath, to him shall be given." Or, those who have lots of money can use that money to get society to change the rules in ways that give them even more wealth and power.
Slide 19. You see this addressed in lots of different ways. Ayn Rand in her book Atlas Shrugged, thinks that society ought to be motivated by nothing other than self interested competition, with some people making out and others not --she leaves no room for altruism. Then you have Sarah Chayes who makes a pretty convincing argument that corruption is one of the principle threats to global security.
Slide 20. Another window into this is found in articles like this profile of Jeff Bezos and Amazon. It includes some pretty stunning statistics. Half of Amazon employees make less than $14 an hour. 1/3 of Amazon employees in Arizona are on food stamps. The only way that a lot Amazon employees can make it is because they get the earned income tax credit, Medicaid, and/or food stamps. These are all things that strike me as pretty egregious.
This article also argues that this situation is attributable to a wide range of policy failures. For example, it is apparently legal for Amazon employees to be forced to sign a "non-compete agreement." So if you're stocking shelves for Amazon, you can't take a similar job working for someone else who would pay better for 18 months.. Which basically means you can't switch jobs and Amazon can pay you whatever they want. One more stunning story from this article: Bezos talks about all this wealth he's managed to accumulate and the possibility of supporting philanthropic causes. Apparentl,y the only thing that he can think of that's worth spending all that money on is space travel (rather than the welfare of the people who helped make him so rich).
Slide 21. There are also articles like this that make a pretty persuasive argument that having lots of wealth and power can affect the way you think. Here, they use the phrase "brain damage."
Slide 22. There is, not surprisingly, a considerable amount of "billionaire bashing" from folks like Bernie Sanders who liks to create the illusion that all of the rich guys are Republicans and not Democrats--which isn't really true. There are lots of very rich very progressives.
Slide 23. The good news, and this goes back to some of my earlier charts, is that there was a time when the rich didn't pull down so much of society's resources. And, if it existed in the past, then it must be possible in the future. We just need to figure out how to roll things back.
Slide 24. The next group--the top 9.9% (or so) is the next step down.
Slide 25. Different folks define this group in different ways. Some folks focus on the top 20% (or the quintile). Other folks talk about it in terms of the "meritocracy," the "establishment," or the "cosmopolitan elite." In genera, this group is composed of professionals at the upper echelons of society – a group that is doing very well. This article talks about how they are the" new aristocracy." Through a variety of dynamics, this group, and their children, have an increasingly solid lock on the top-echelon positions within the social hierarchy.
Slide 26. Charles Murray did this book a number of years ago which really was the first to alert me to the magnitude of the split between the elites and the rest of society. In an effort to filter out the effects of racism, his study focused solely on white society. He documented a large and rapidly widening divide based on both social and economic factors. The folks at the lower end of this divide are the "left behinds" that I will talk about in a moment.
Slide 27. This is another Thomas Edsall article that I highly recommended, which has citations to a lot of other articles that are trying to explain the many advantages enjoyed by this top chunk of the population.
Slide 28. Not surprisingly, these folk are resented a lot by the rest of the society. It is also not surprising that there are huge differences in the way that elites and the rest of society think about things. These statistics bear this out. You'll notice the huge differences between the opinions of the the Democratic elite and the electorate at large. That is also a big part of the tension that is dividing our society.
Slide 29. The third major group that I want to talk about along the distributional continuum is located at the bottom of the hierarchy. It's a group that I call the "protected classes" and it consists of groups that have, in one way or anothe,r been historically discriminated against. It is the group that Democrats seek to champion.
Slide 30. You can go to Wikipedia and find a list of official protected classes and the laws that gave them protected status. The goal in protecting these groups is to remedy some of the most terrible exploitation and oppression in US history.
Slide 31. We've already talked about the oppression of women and the "Underside of History." This terrifying graphic of the layout of a slave ship emphasizes the original sin underlying racial discrimination, the segregation era, and the terrible injustices that remain. The bottom line is that you have a number of different groups who, in one way or another, have been, and continue to be exploited and oppressed in economic (as well as social) terms.
Slide 32. This leads us to my last group on the distributional divide, the "left behind" that the Republican Party have been championing. And these are folks who are struggling economically (and sometimes socially) but don't fall into one of the protected classes. This is, in a very real sense, the group of people that the protected classes are being protected from. That's why I sometimes call them the "protected from classes." Liberals tend to see this group as racist, sexist, homophobic, and guilty of discrimination against all the other classes.
Slide 33. These two books, Coming Apart and The New Class Conflict, examine the class separation within white society and the very real difficulties faced by the left behind group. With all of the struggles that the left behind face, it's not surprising that they are resentful of the assistance being given to the protected classes--often, they think, their expense. The resulting tension has helped produce a major conflict between these two groups.
Slide 34. You can see this backlash with respect to gender issues. Take this chart. As Democrats started to embrace women's rights (and the shift of some opportunities from men to women) men began to leave the Democratic Party and join the Republicans. At this point, there is a huge gender chasm between the parties.
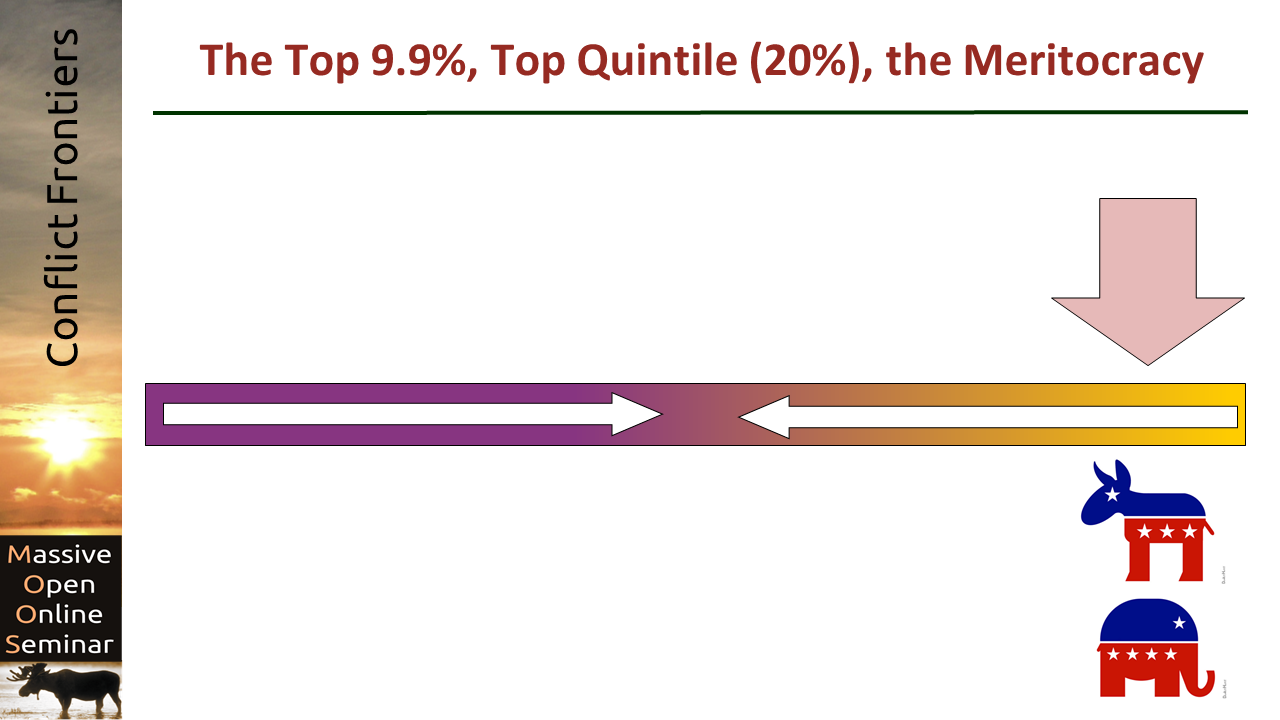
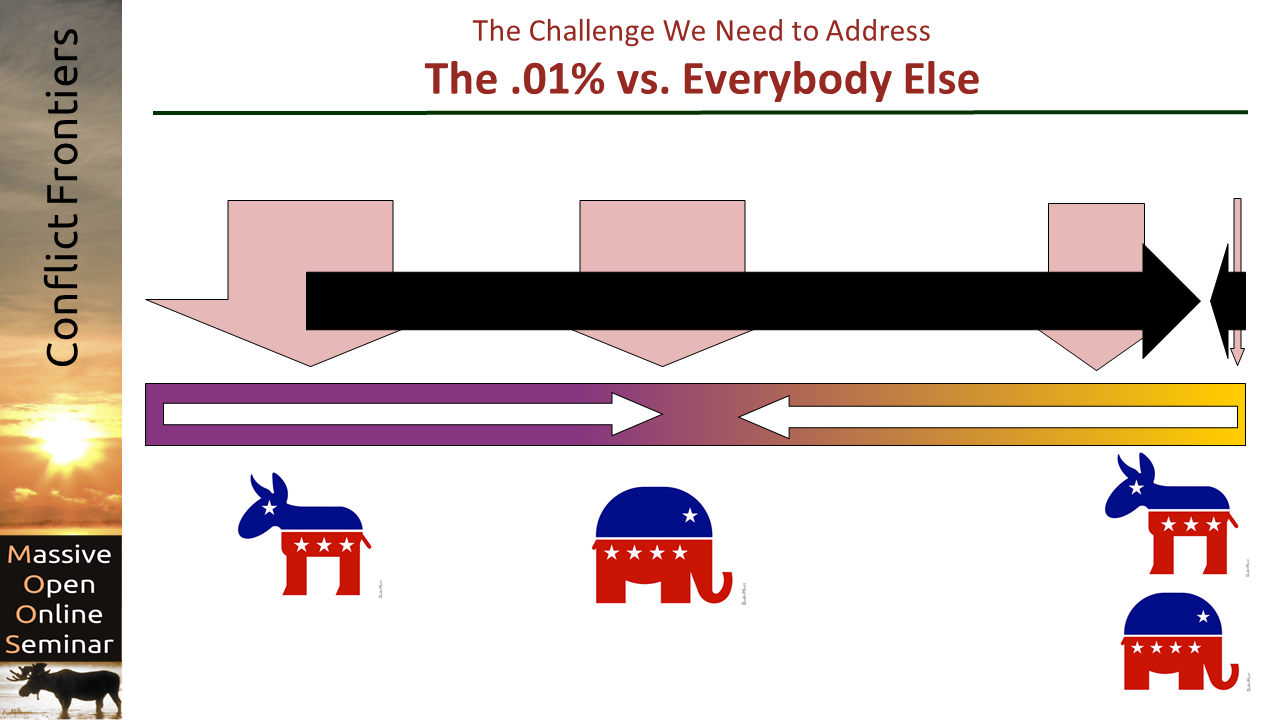
Slide 35. So the big, purple/gold, distributional conflict goes back to those rather stunning statistics I showed you earlier about just how much more wealth and income the .01% has managed to acquire over the last few decades and how that shift has contributed to the social problems that now afflict the rest of society. To a very significant degree, this shift is the core of the authoritarian, plutocratic populism problem. The vast mass of the population are the populists (on the left and the right). And the plutocrats, with their authoritarian tendencies, are the increasingly powerful very, very rich. Finding effective ways to persuade/pressure these folks to release some of their money is key to a more equitable and more democratic society.
Slide 36. Unfortunately, this is not going to happen unless you can get some sort of peace between the protected classes and the left behinds. There are undoubtedly big differences to be resolved, and the two sides need to recognize that they have a common interest in challenging the plutocrats.
Slide 37. This is also not going to happen unless the populists on the left and the right can somehow form some sort of equitable partnership with the professional elites who play such a dominant role in determining how society is run. So there's a need for peacebuilding there, as well.
Slide 38. Finally, there is a need for peacebuilding between the very rich and the rest of the society. There are a lot of very rich folks--Bill Gates comes to mind--who are honestly trying to use their wealth to advance the interests of the broader population. We need much more effective ways of persuading the rich to use their wealth to help advance the goal of a more prosperous, equitable, and democratic society capable of resisting the slide towards authoritarian plutocracy.
Referenced Resources:
- Slide 4: Paul Bloom. "People Don't Actually Want Equality" The Atlantic Oct. 2015.
- Slide 5 and 6: Building a Better America−−One Wealth Quintile at a Time
- Slide 8: Personal income in the United States from 1990 to 2017and Income Shares – Source: US Income Share of the Top 1%; By: CBO; Permission: Attribution-ShareAlike 3.0 Unported.
- Slide 10: The Richest One Percent of America Gets Half the Trump Tax Cuts
- Slide 11: Myths of the 1 Percent: What Puts People at the Top
- Slide 12: Understanding the Historic Divergence Between Productivity and a Typical Worker’s Pay Why It Matters and Why It’s Real
- Slide 13: The Complex Causes of Social Problems
- Slide 17: How You, I, and Everyone Got the Top 1 Percent All Wrong
- Slide 18: Thomas Piketty. Capital in the Twenty-First Century.
- Slide 19: Ayn Rand. Atlas Shrugged and Sarah Chayes Thieves of State: Why Corruption Threatens Global Security.
- Slide 20: Jeff Bezos’s $150 Billion Fortune Is a Policy Failure
- Slide 21: Power Causes Brain Damage: How leaders lose mental capacities—most notably for reading other people—that were essential to their rise
- Slide 22: Actually, the ‘billionaire class’ might be more progressive than Sanders says
- Slide 23: Understanding the Historic Divergence Between Productivity and a Typical Worker’s Pay Why It Matters and Why It’s Real.
- Slide 25: The 9.9 Percent Is the New American Aristocracy
- Slide 26 and 33: Charles Murray Coming Apart: The State of White America 1960-2010
- Slide 27: How the Other Fifth Lives
- Slide 28: The Democratic Party Picked an Odd Time to Have an Identity Crisis and Insights from the 2016 VOTER Survey
- Slide 31: Elise Boulding. The Underside of History, Vol. 2.
- Slide 33: Joel Kotkin. The New Class Conflict.
- Slide 34: What Happens if the Gender Gap Becomes a Gender Chasm?
Photo Credits:
- Slide 16, 24, 29, 32, 35-38: Political Elephant Donkey – Source: https://www.flickr.com/photos/donkeyhotey/6262122778; By DonkeyHotey; Permission: Creative Commons 2.0.
- Slide 31: Slave Ship – Source: https://commons.wikimedia.org/wiki/File:African_slave_ship_diagram.jpg#/...(1854)_p038_A_SLAVE_SHIP.jpg; Permission: Public Domain.
- Slide 38: Bill Gates – Source: https://commons.wikimedia.org/wiki/File:Bill_Gates_-_World_Economic_Foru... By: Andy Mettler; Permission: Creative Commons Attribution-Share Alike 2.0 Generic


